Who Really Moves the Gold Price?
Gold is one of the most misunderstood markets in the world.
On the surface, the narrative sounds simple: central banks are buying gold, therefore gold should be going up. But that framing misses almost everything that actually matters. It confuses who holds gold with who is buying gold, and it mistakes short-term price action for long-term demand.
The result is widespread confusion:
- Gold sells off even as central banks buy
- The largest gold holders appear inactive
- Smaller countries seem to matter more than global superpowers
I have spent hours studying the data in depth and in this article I break the gold market down properly — separating stocks from flows, paper from physical, and price discovery from reserve strategy — to answer a simple question:
Who really moves the gold price?
1) The top gold holders are largely static
The world’s largest official gold holders are well known:
- United States
- Germany
- Italy
- France
- Japan
- Switzerland
- United Kingdom
- Russia
- China
- India
These countries collectively hold the vast majority of the world’s official gold reserves.
What’s surprising is what they haven’t been doing.
Using IMF International Liquidity data (physical gold volume only), the change in holdings from Q1 2024 to Q3 2025 shows that:
- The US, Germany, Italy, France, Japan, Switzerland, the UK and Russia are effectively flat
- China is the only top-tier holder to show a clear and sustained increase
- India has added modestly, but not at a market-moving scale
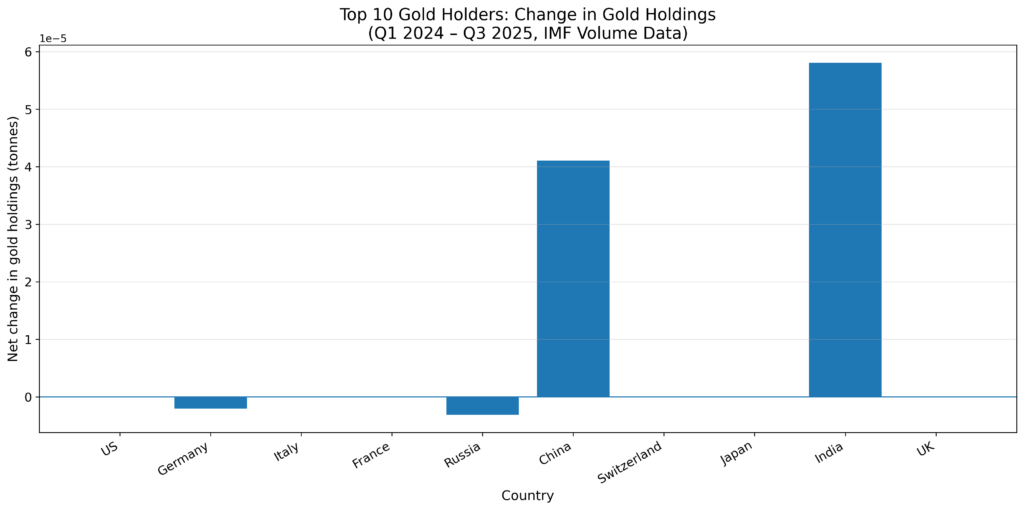
Key takeaway:
Among the world’s ten largest official gold holders, only China and India increased their gold reserves between Q1 2024 and Q3 2025. The remaining major holders kept reserves broadly unchanged.
This matters, because it immediately challenges the idea that “central banks” as a group are driving marginal demand.
2) The real buyers sit outside the top-10 holders
When we change the question from “Who holds the most gold?” to “Who added the most gold?” the picture changes completely.
Looking at net changes in holdings over the same period (Q1 2024 → Q3 2025), the leading buyers include countries such as:
- Poland
- Turkey
- Czechia
- Hungary
- Brazil
- Iraq
- China
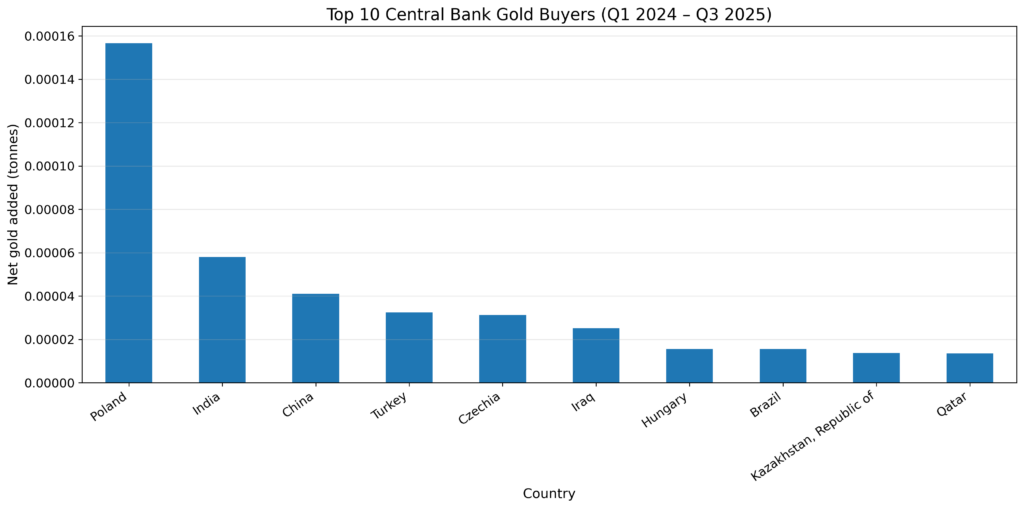
These are not legacy holders. They are mid-sized and emerging economies actively reshaping reserve strategy.
This distinction is critical:
The largest gold holders are not the largest gold buyers. Gold accumulation since 2024 has been driven by a different set of countries entirely.
That explains why allocation-percentage charts and headline reserve tables can be so misleading.
3) Timing matters: the buying cycle didn’t begin until after Q1 2024
When gold buying is broken down quarter by quarter, another important insight appears:
- From late 2023 through Q1 2024, there is little evidence of sustained net buying among the eventual top buyers
- The accumulation cycle begins in earnest from Q2 2024 onward
- The same buyers reappear quarter after quarter, indicating structural demand, not opportunistic trading
This is a regime shift, not a continuation.
There was no meaningful net buying by the eventual top buyers in late 2023 or early 2024. The accumulation phase begins after Q1 2024.
That timing lines up closely with growing concern over fiscal dominance, sanctions risk, and long-term confidence in the USD-centric system.
4) Some major countries hold little or no gold at all
An under-discussed part of the gold market is the group of large, advanced economies that hold little or no gold.
Examples include:
- Canada — 0 tonnes (sold its entire reserve by 2016)
- Norway — effectively zero
- New Zealand — zero
- Australia — ~80 tonnes
- Denmark — ~66 tonnes
- Sweden — ~125 tonnes
These are systemically important countries that have chosen to rely almost entirely on fiat FX reserves.
This creates an asymmetric risk:
If even one large, zero-gold country decided to build a modest strategic allocation, it would represent entirely new, structurally sticky demand.
Canada, in particular, stands out as a pure expression of confidence in the current monetary order — and therefore a potential future marginal buyer if that confidence ever shifts.
5) So what actually moves the gold price day to day?
Gold is influenced by several distinct forces, each operating on different timeframes.
Futures & derivatives (day-to-day price setter)
- Gold’s daily price is primarily set in leveraged futures markets
- These markets trade volumes many multiples of annual mine supply
- Liquidation events, margin calls and trend-following flows dominate short-term moves
The day-to-day price of gold is set by futures markets, not physical demand — which therefore poses a manipulation risk within the paper markets.
ETFs (sentiment amplifier)
- ETF flows represent how the public and institutions gain exposure
- They respond to price rather than lead it
- Large inflows/outflows can amplify trends, but usually lag futures moves
Central banks (long-term anchor)
- Central banks buy physical gold, slowly and quietly
- They are largely price-insensitive
- Their role is not to trade price, but to change the long-term equilibrium
Futures decide the path. ETFs amplify the move. Central banks decide where the floor is.
Jewellery & retail
- Jewellery is the largest physical demand category by volume
- Highly price-elastic and counter-cyclical
- Stabilises markets but rarely drives them
Retail bar and coin demand is emotionally powerful, but small in market-impact terms.
6) Pulling it all together
The gold market only makes sense when these layers are separated:
- Short-term volatility is driven by leveraged futures positioning
- Medium-term trends are reinforced or dampened by ETF flows
- Long-term direction is shaped by central-bank reserve strategy
This framework explains why gold can:
- Sell off violently even as central banks buy
- Recover quickly after liquidation events
- Grind higher despite restrictive monetary policy
Why this matters now
The timing of this analysis is critical.
Gold is not moving in a vacuum — it is moving against a backdrop of:
- Record government debt issuance
- Persistent fiscal deficits across developed economies
- Rising geopolitical fragmentation and sanctions risk
- A growing divergence between financial markets and physical reserve behaviour
What makes the current cycle different from previous gold rallies is who is buying — and who is not.
- The world’s largest gold holders are mostly sitting still
- The incremental demand is coming from a new group of countries actively reassessing reserve security
- Several large, advanced economies still hold little or no gold at all, leaving future demand asymmetric
At the same time, gold’s price discovery remains dominated by futures markets, meaning:
- Sharp drawdowns can occur even as long-term fundamentals improve
- Liquidation events can mask underlying structural demand
- Price weakness does not necessarily invalidate the broader trend
This creates a setup where short-term volatility and long-term direction are increasingly disconnected.
Gold is being quietly accumulated by central banks while its price is violently repriced by leveraged markets.
For investors, the implication is simple:
- Day-to-day price moves are noise
- Structural accumulation is signal
Understanding who is buying, when they started, and why they are buying is more important now than at any point in the past decade.
Final takeaway
Gold’s short-term price is dominated by leveraged futures markets, while physical demand — particularly from central banks — shapes the long-term trend. The recent wave of central-bank buying has not been driven by the world’s largest gold holders, but by a different set of countries actively re-thinking reserve strategy.
Understanding that distinction is the key to understanding gold.
This article is for informational and educational purposes only. Nothing here constitutes financial advice. Always conduct your own research and consult a qualified financial adviser before making any investment decisions.
Get the next piece delivered direct to your inbox.