Gold: 2008 or 2020?
A weight-of-evidence framework for the most important inflection point in the gold market since the financial crisis
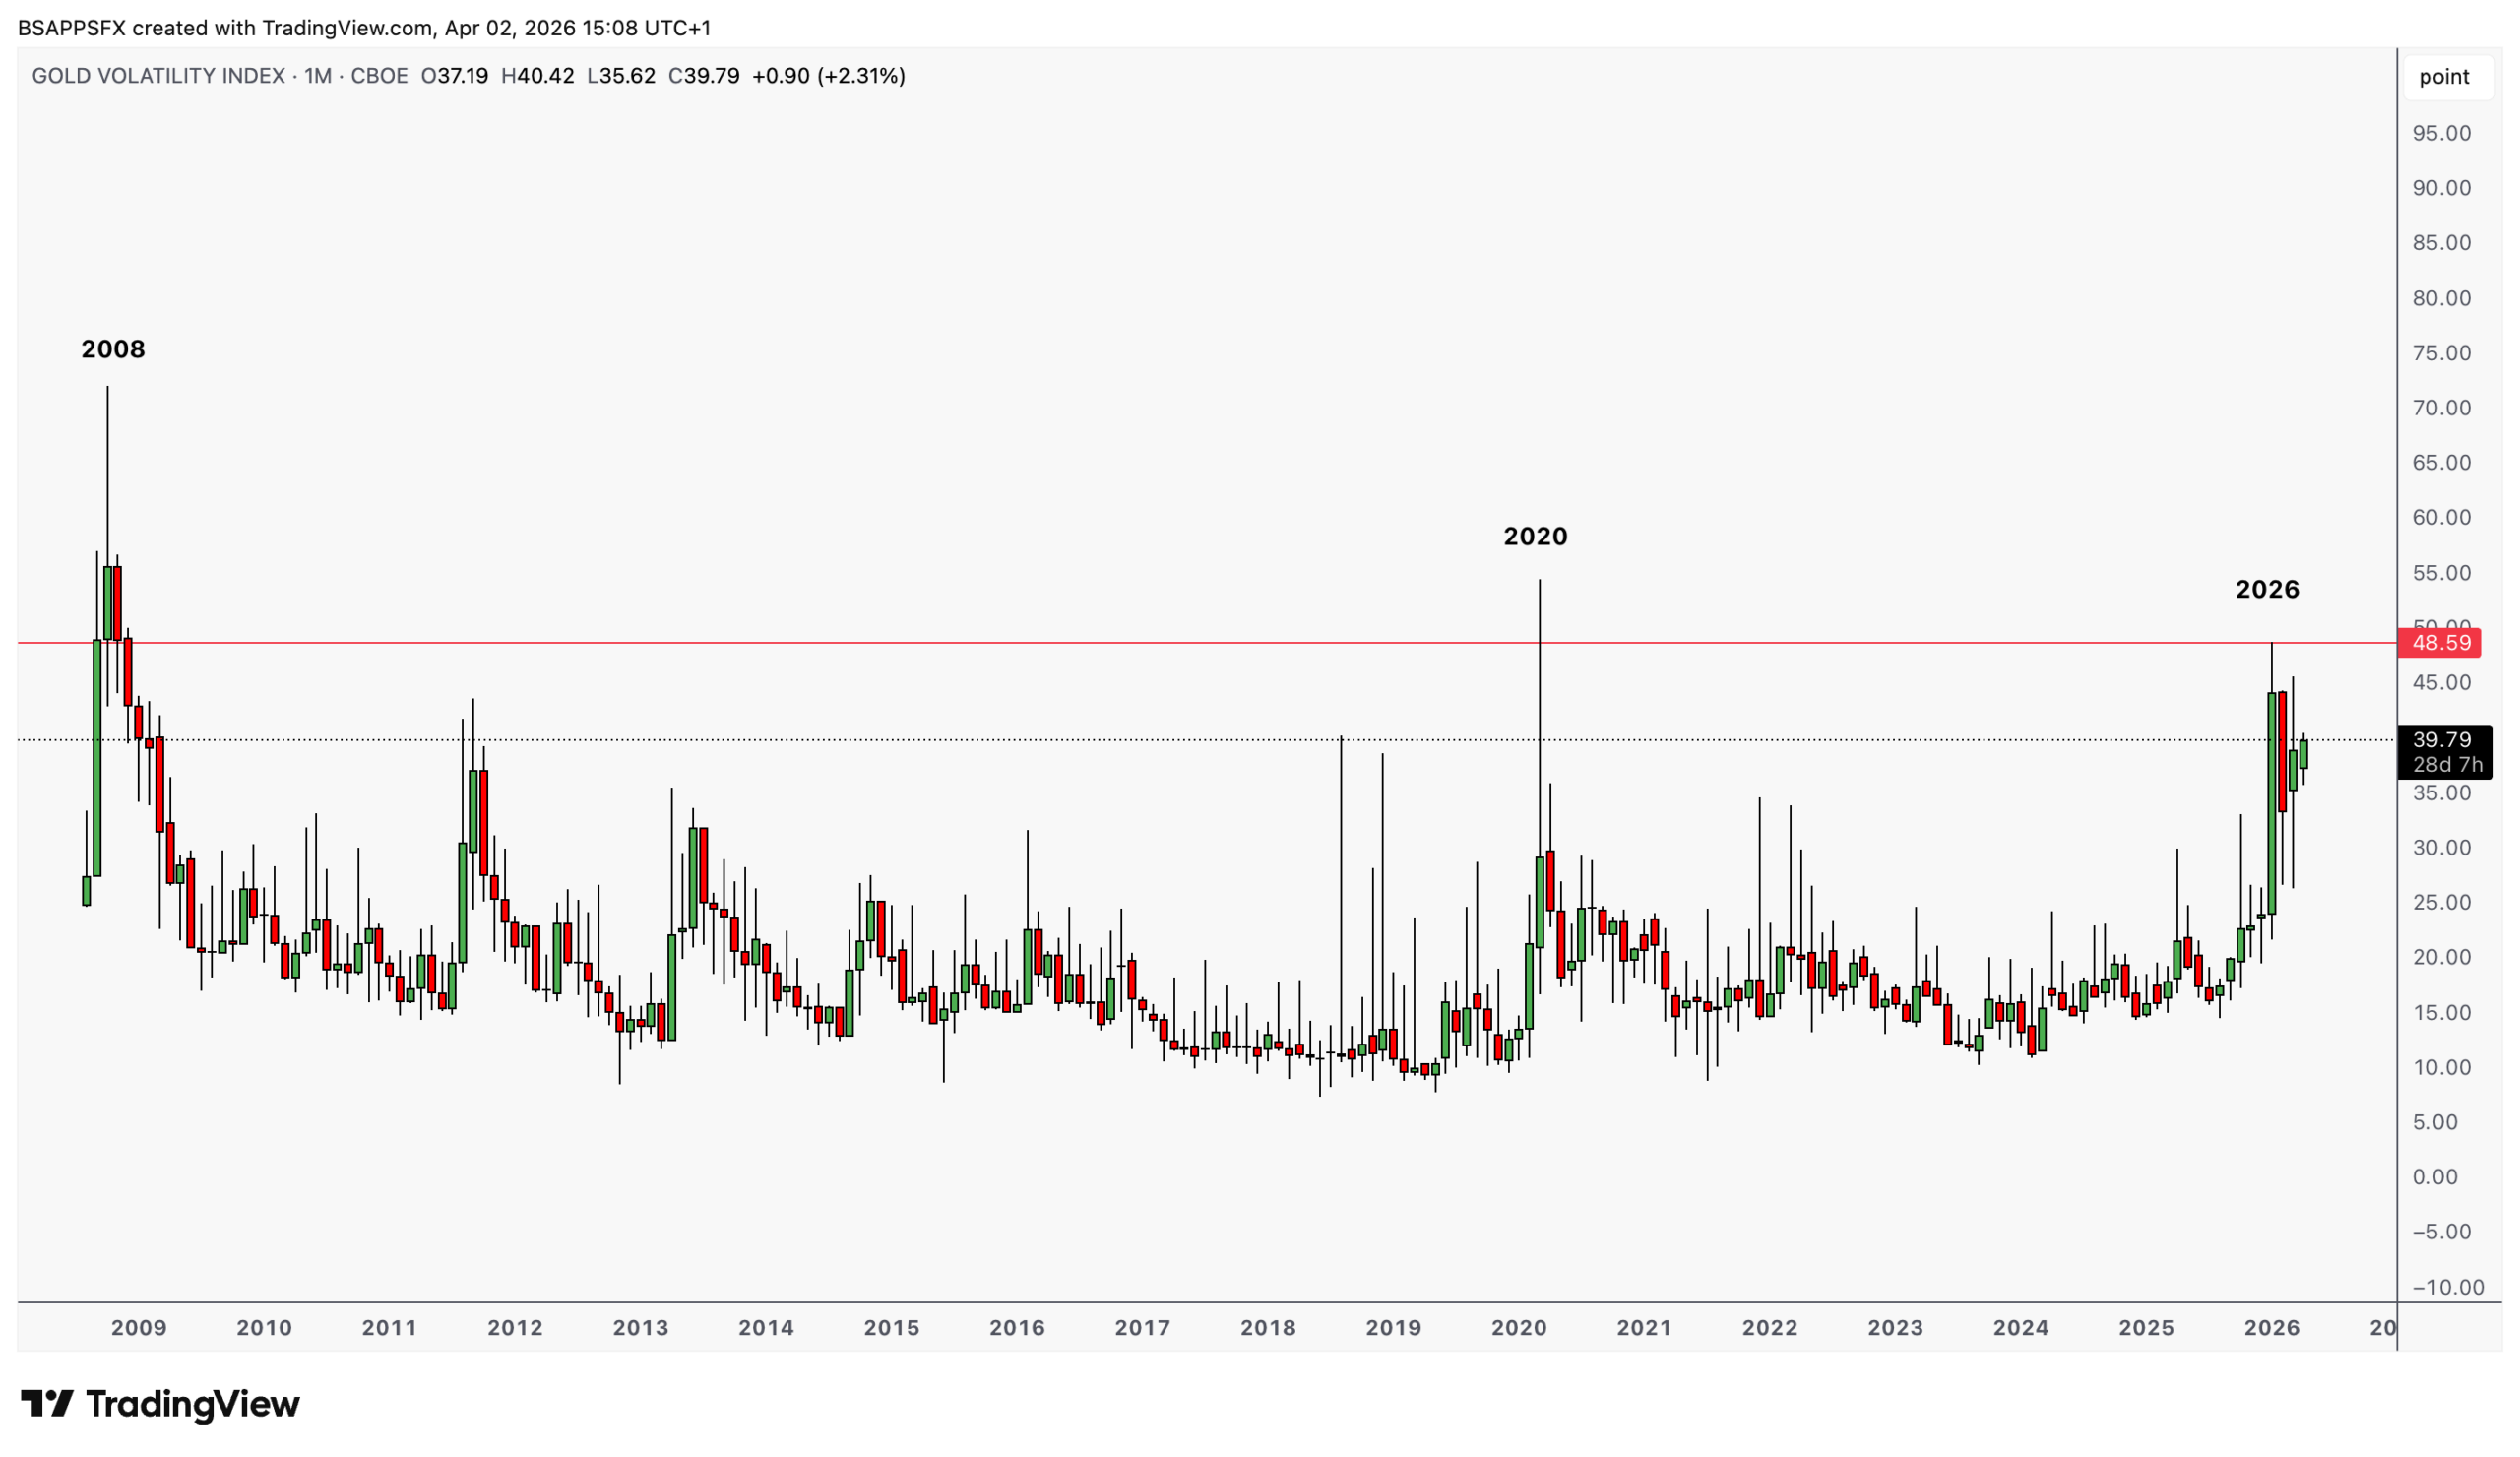
Gold just posted its worst month since October 2008. A 25% drop from all-time highs. A single session that touched $4,100 before snapping back violently. GVZ volatility at levels only seen twice in recorded history. And a weekly momentum signal so rare it has appeared just three times in four decades. This article is not a prediction. It is a framework — built from signals the market is generating right now, mapped against the only two historical templates that come close to matching what we are seeing today.
The question the market is trying to answer in real time is deceptively simple: is this 2008 or 2020? The answer determines everything — from how deep the correction goes, to how long it lasts, to what the gold market looks like on the other side.
Everything that follows is an attempt to answer that question using price action, volatility, positioning data, central bank flows, and ETF demand — layered against the macro backdrop that is shifting, visibly, day by day.
The signals that started this
Every framework needs an anchor. A data point rare enough to demand attention rather than dismissal.
The weekly Rate of Change indicator — ROC(5) — measures the percentage change in price over five weeks. It is a momentum exhaustion tool. When it reaches extreme levels it signals that a move has been so violent and so compressed in time that historical precedent becomes the most reliable guide available.
Gold’s weekly ROC(5) recently hit -13. Since 1997 — nearly three decades of data — this reading has occurred exactly three other times. 2006. 2008. 2008 again. On all three occasions gold experienced a significant pullback before any resumption of the broader trend. The sample size is small. The hit rate is 100%.
The GVZ confirmation is equally important. The gold volatility index measures the options market’s expectation of 30-day volatility — gold’s equivalent of the VIX. When it spikes to these levels the options market is pricing significant fear and uncertainty into the near-term price. The ROC measures what price has already done. The GVZ measures what the options market expects next. When they align, the signal has weight.
The mechanism — why gold fell
To understand where gold goes next, you need to understand precisely what caused the drop. The mechanism matters as much as the magnitude.
The proximate trigger was the Iran conflict. US and Israeli strikes in early March. Iran’s closure of the Strait of Hormuz. Oil surging toward $120. But the mechanism underneath was liquidity — the same mechanism that caused gold to drop in March 2020, in 2008, and in every major crisis before them.
When global risk-off hits simultaneously — oil spike, equity selloff, bond market stress — institutions face margin calls, redemptions, and urgent demand for cash. Gold is the most liquid asset in the world. It trades 24 hours. It has deep markets globally. When you need cash immediately, you sell what you can sell — not what you want to sell.
The cross-asset picture during peak stress was textbook liquidity crisis: stocks down, oil up, USD up, yields up, gold down. Everything moving in a coherent direction confirming the diagnosis. Forced selling. Not a fundamental reassessment of gold’s value.
The $4,100 intraday low with an immediate snap-back is the clearest evidence of this. Liquidity-driven selloffs have that character — violent, fast, then partial recovery as forced sellers exhaust themselves.
“Foreign central banks sold their holdings of US Treasuries to their lowest level since 2012, with $82 billion leaving the New York Fed’s custody since February 25th alone — as countries scrambled to defend currencies against the oil shock.”
Financial Times, March 2026The Treasury selling added supply to the bond market from one direction — pushing yields higher — while domestic bond buyers were simultaneously pricing in recession and buying Treasuries from the other. The yield market was caught between two forces. That tension explains much of the volatility in rates throughout March.
Who was selling — and who never stopped buying
This is where the analysis becomes genuinely revealing. When you break down gold demand by geography over the past five weeks, the picture that emerges is not one of broad capitulation. It is one of a very specific, very Western panic layered on top of a completely uninterrupted structural bid from the East.
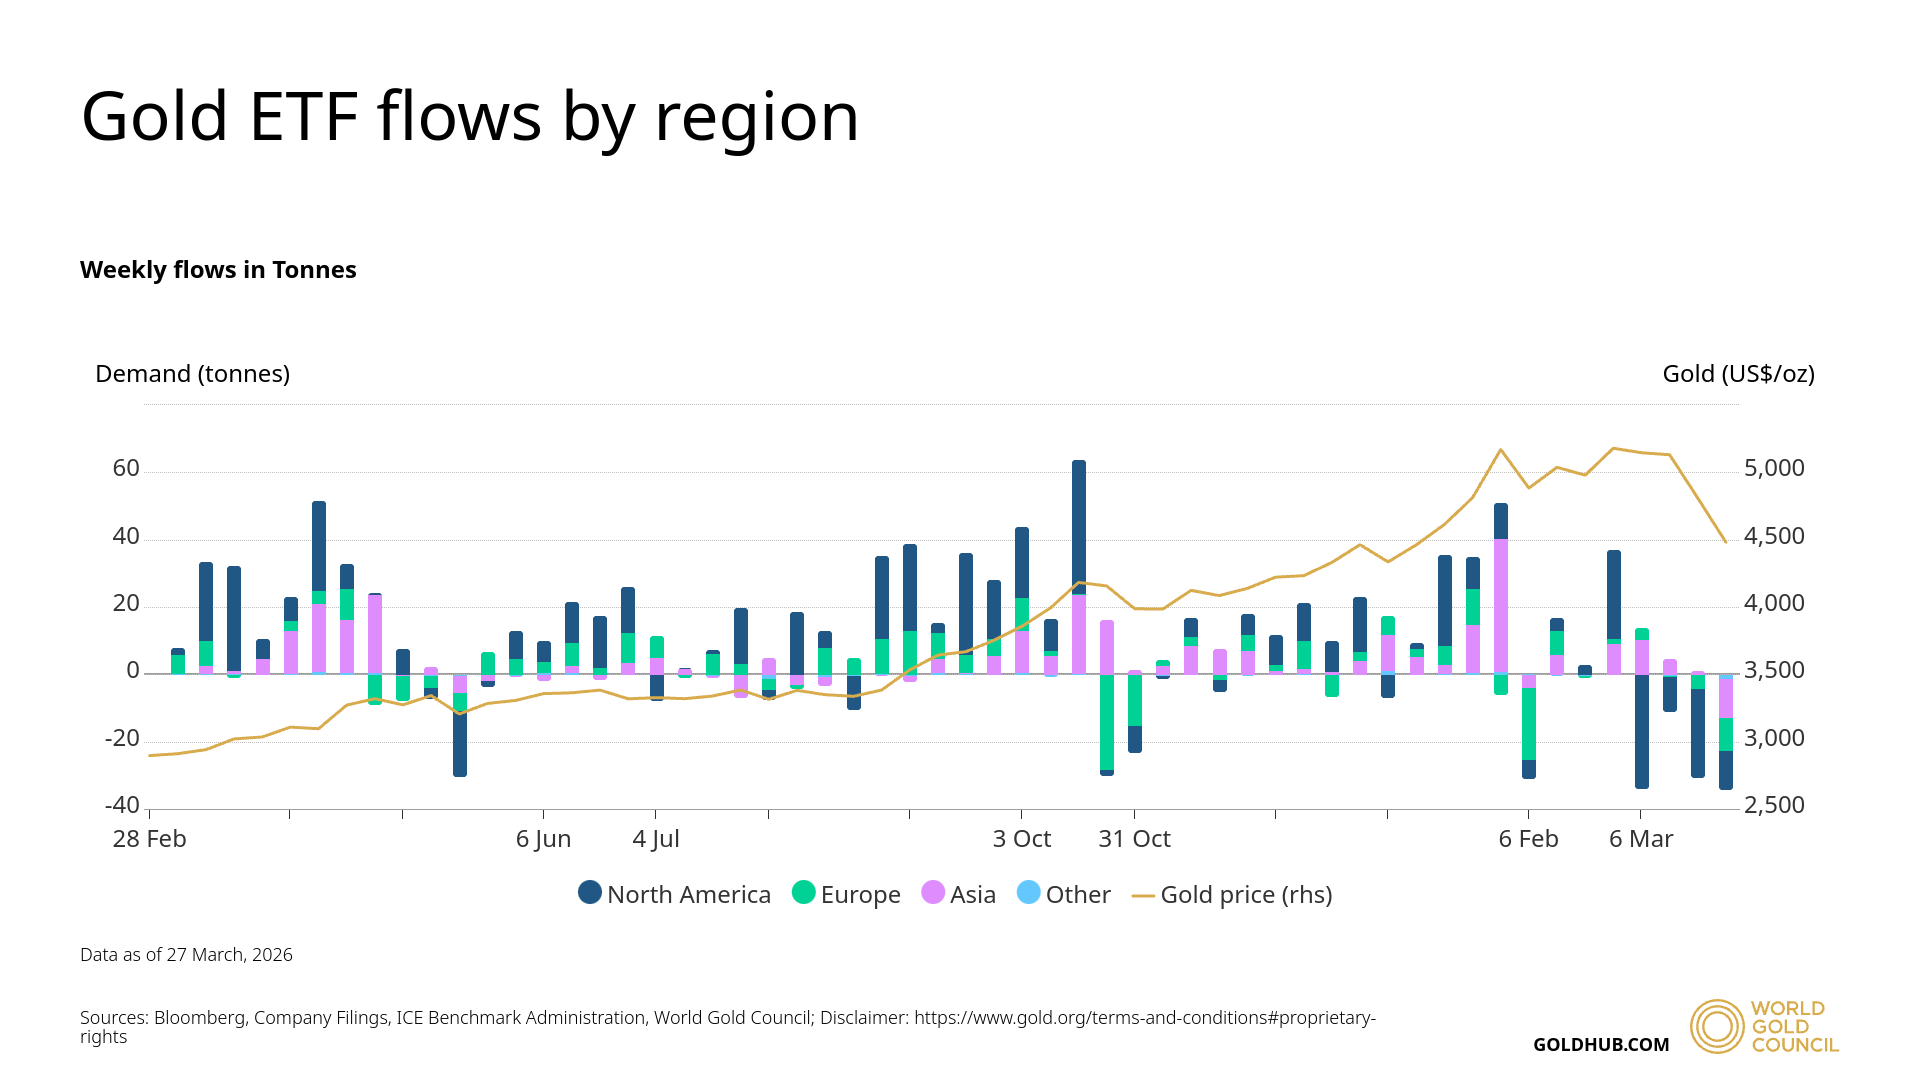
The chart above tells the story in one image. The negative bars in recent weeks — the selling — are entirely North America and Europe. Western investors. ETF holders panic-selling GLD and IAU into the decline as stop losses triggered, risk managers forced position reduction, and retail investors raised cash.
Asia and Other regions? Consistently positive throughout. The Eastern bid never wavered.
This is not a gold market that is fundamentally broken. It is a gold market where Western tourists panicked and the structural buyers held firm. Those are very different things with very different implications for what comes next.
The West was selling. The East never stopped buying.
Positioning — stressed but not broken
The CFTC’s Commitments of Traders report tracks the long and short positions of speculative traders in gold futures. Reading it correctly over the past five weeks tells a more nuanced story than the headline price action suggests.
| Week ending | Longs | Shorts | Net | Ratio | Trend |
|---|---|---|---|---|---|
| 24 Feb 2026 Peak | ~281,000 | ~56,000 | +225,000 | 5.0:1 | |
| 03 Mar 2026 | ~250,000 | ~53,500 | +196,500 | 4.7:1 | |
| 10 Mar 2026 | ~215,445 | ~59,871 | +155,574 | 3.6:1 | |
| 17 Mar 2026 | 215,961 | 56,092 | +159,869 | 3.9:1 | |
| 24 Mar 2026 Latest | 220,861 | 52,534 | +168,327 | 4.2:1 |
The headline observation is that the long/short ratio has barely moved — from 5:1 at the peak to 4.2:1 at the latest reading. What HAS changed dramatically is the price, which is down 27%. Same ratio. Completely different price level.
This doesn’t tell you that longs have been flushed. It tells you that longs have been stress-tested and held. The conviction behind the long side hasn’t materially broken despite a 27% drawdown. A true capitulation would see the ratio collapse toward 2:1 or below. That hasn’t happened.
The longs that remain are the genuinely convicted holders. The tourists left. The structural buyers stayed.
The structural bid — central bank demand
Here is the single most important structural difference between the current environment and 2008 that almost nobody is discussing loudly enough.
In 2008, central banks were net sellers of gold. For the twenty-one years prior to 2010 they had been selling an average of 400-500 tonnes per year. They were actively adding supply to the market during the very crisis that gold was supposed to benefit from. The structural bid simply did not exist.
Central banks became net buyers in 2010 for the first time in over two decades. Since then, and particularly since the freezing of Russian FX reserves in 2022 demonstrated that dollar assets could be weaponised, the pace of buying has accelerated dramatically. In 2022 central banks purchased a record 1,136 tonnes. In 2023, 1,037 tonnes. The de-dollarisation bid is structural, not cyclical — and it does not sell on volatility.
The World Gold Council’s February 2026 data confirms this bid remains completely intact through the current selloff:
The Czech Republic has now bought gold for 36 consecutive months. China for 16. A growing number of African central banks — Uganda, Kenya — are entering the market for the first time, broadening the buyer base beyond the established names. The World Gold Council notes this explicitly in its February report: the emerging market story continues and is widening, not contracting.
This matters enormously for interpreting the current selloff. In 2008, there was no central bank floor. Today, there is a deep, persistent, geographically diverse institutional bid that buys on strategy rather than sentiment. It does not react to a 25% drawdown the way a retail investor or an ETF holder does. It simply accumulates.
ETFs — the self-limiting headwind
GLD launched in November 2004 — just four years before the 2008 crisis. At the time of that crisis it held roughly $10-15 billion in assets. Today GLD alone holds approximately $185 billion. The gold ETF market is 10-15 times larger as a demand channel than it was in 2008.
This cuts both ways. ETF outflows today are capable of generating price moves that would have been structurally impossible in 2008. The selling mechanism is significantly larger. But the recovery mechanism is equally amplified — ETF inflows when sentiment reverses are fast, large, and historically aggressive.
The critical insight is that ETF outflows are inherently self-limiting. You can only sell what you own. Western gold ETF holdings are finite. Once the redemption wave exhausts itself — which historically takes weeks, not months, from peak panic — the only marginal buyer left is the Eastern structural demand that never stopped. At that point, even flat Western demand causes price recovery because Eastern accumulation continues into reduced supply.
March 2020 demonstrated this mechanism precisely. ETF outflows were enormous as retail investors raised cash. Gold dropped 15%. Then the liquidity injection came, sentiment reversed, and ETF inflows in the subsequent weeks were the fastest ever recorded. Gold made all-time highs by August 2020.
The narrative shift happening in real time
For weeks following the Iran strike, the cross-asset picture was internally consistent — classic stagflation pricing. Stocks down, oil up, yields rising, dollar strengthening, gold falling. Everything telling one story.
Then the crack appeared. On a Friday in late March, oil was up 8%, USD was up, yields were up, stocks were down — but gold was up. For the first time, gold decoupled from the selling. The market was beginning to price something different.
The following session confirmed it. Oil up. USD up. Stocks down. But yields down. The bond market had voted — recession fear was beginning to dominate over inflation fear. When yields fall in a risk-off environment it means the market is saying: the growth shock will ultimately outweigh the inflation shock, and the next Fed move is a cut, not a hike.
The FedWatch repricing confirmed the regime change in precise, measurable terms. One week prior to writing this article, the market was pricing a 12% probability of a rate hike by June 2026 — the most bearish possible macro environment for gold. Within 72 hours, that probability collapsed to under 2%. A cut probability appeared in June pricing for the first time, initially at 1.8%, then jumping to 10.9% overnight as tariff announcements landed.
The 2-year Treasury yield — almost purely a Fed expectations instrument — dropped 2% in a single session. The 10-year fell 16 basis points over two days, from 4.48% toward 4.32%. The bond market is front-running a pivot.
Then this morning: Trump’s speech reignited Iran fears. Oil is up 14% as this article is written. Gold is down 3.5%. DXY is up 0.60%. The two narratives are still fighting. The market has not yet resolved which one wins.
The technical picture — where price is right now
The chart below shows the current daily structure with the Fibonacci levels mapped from the $5,400 high to the $4,100 intraday low, and the three key moving averages that define the roadmap going forward.
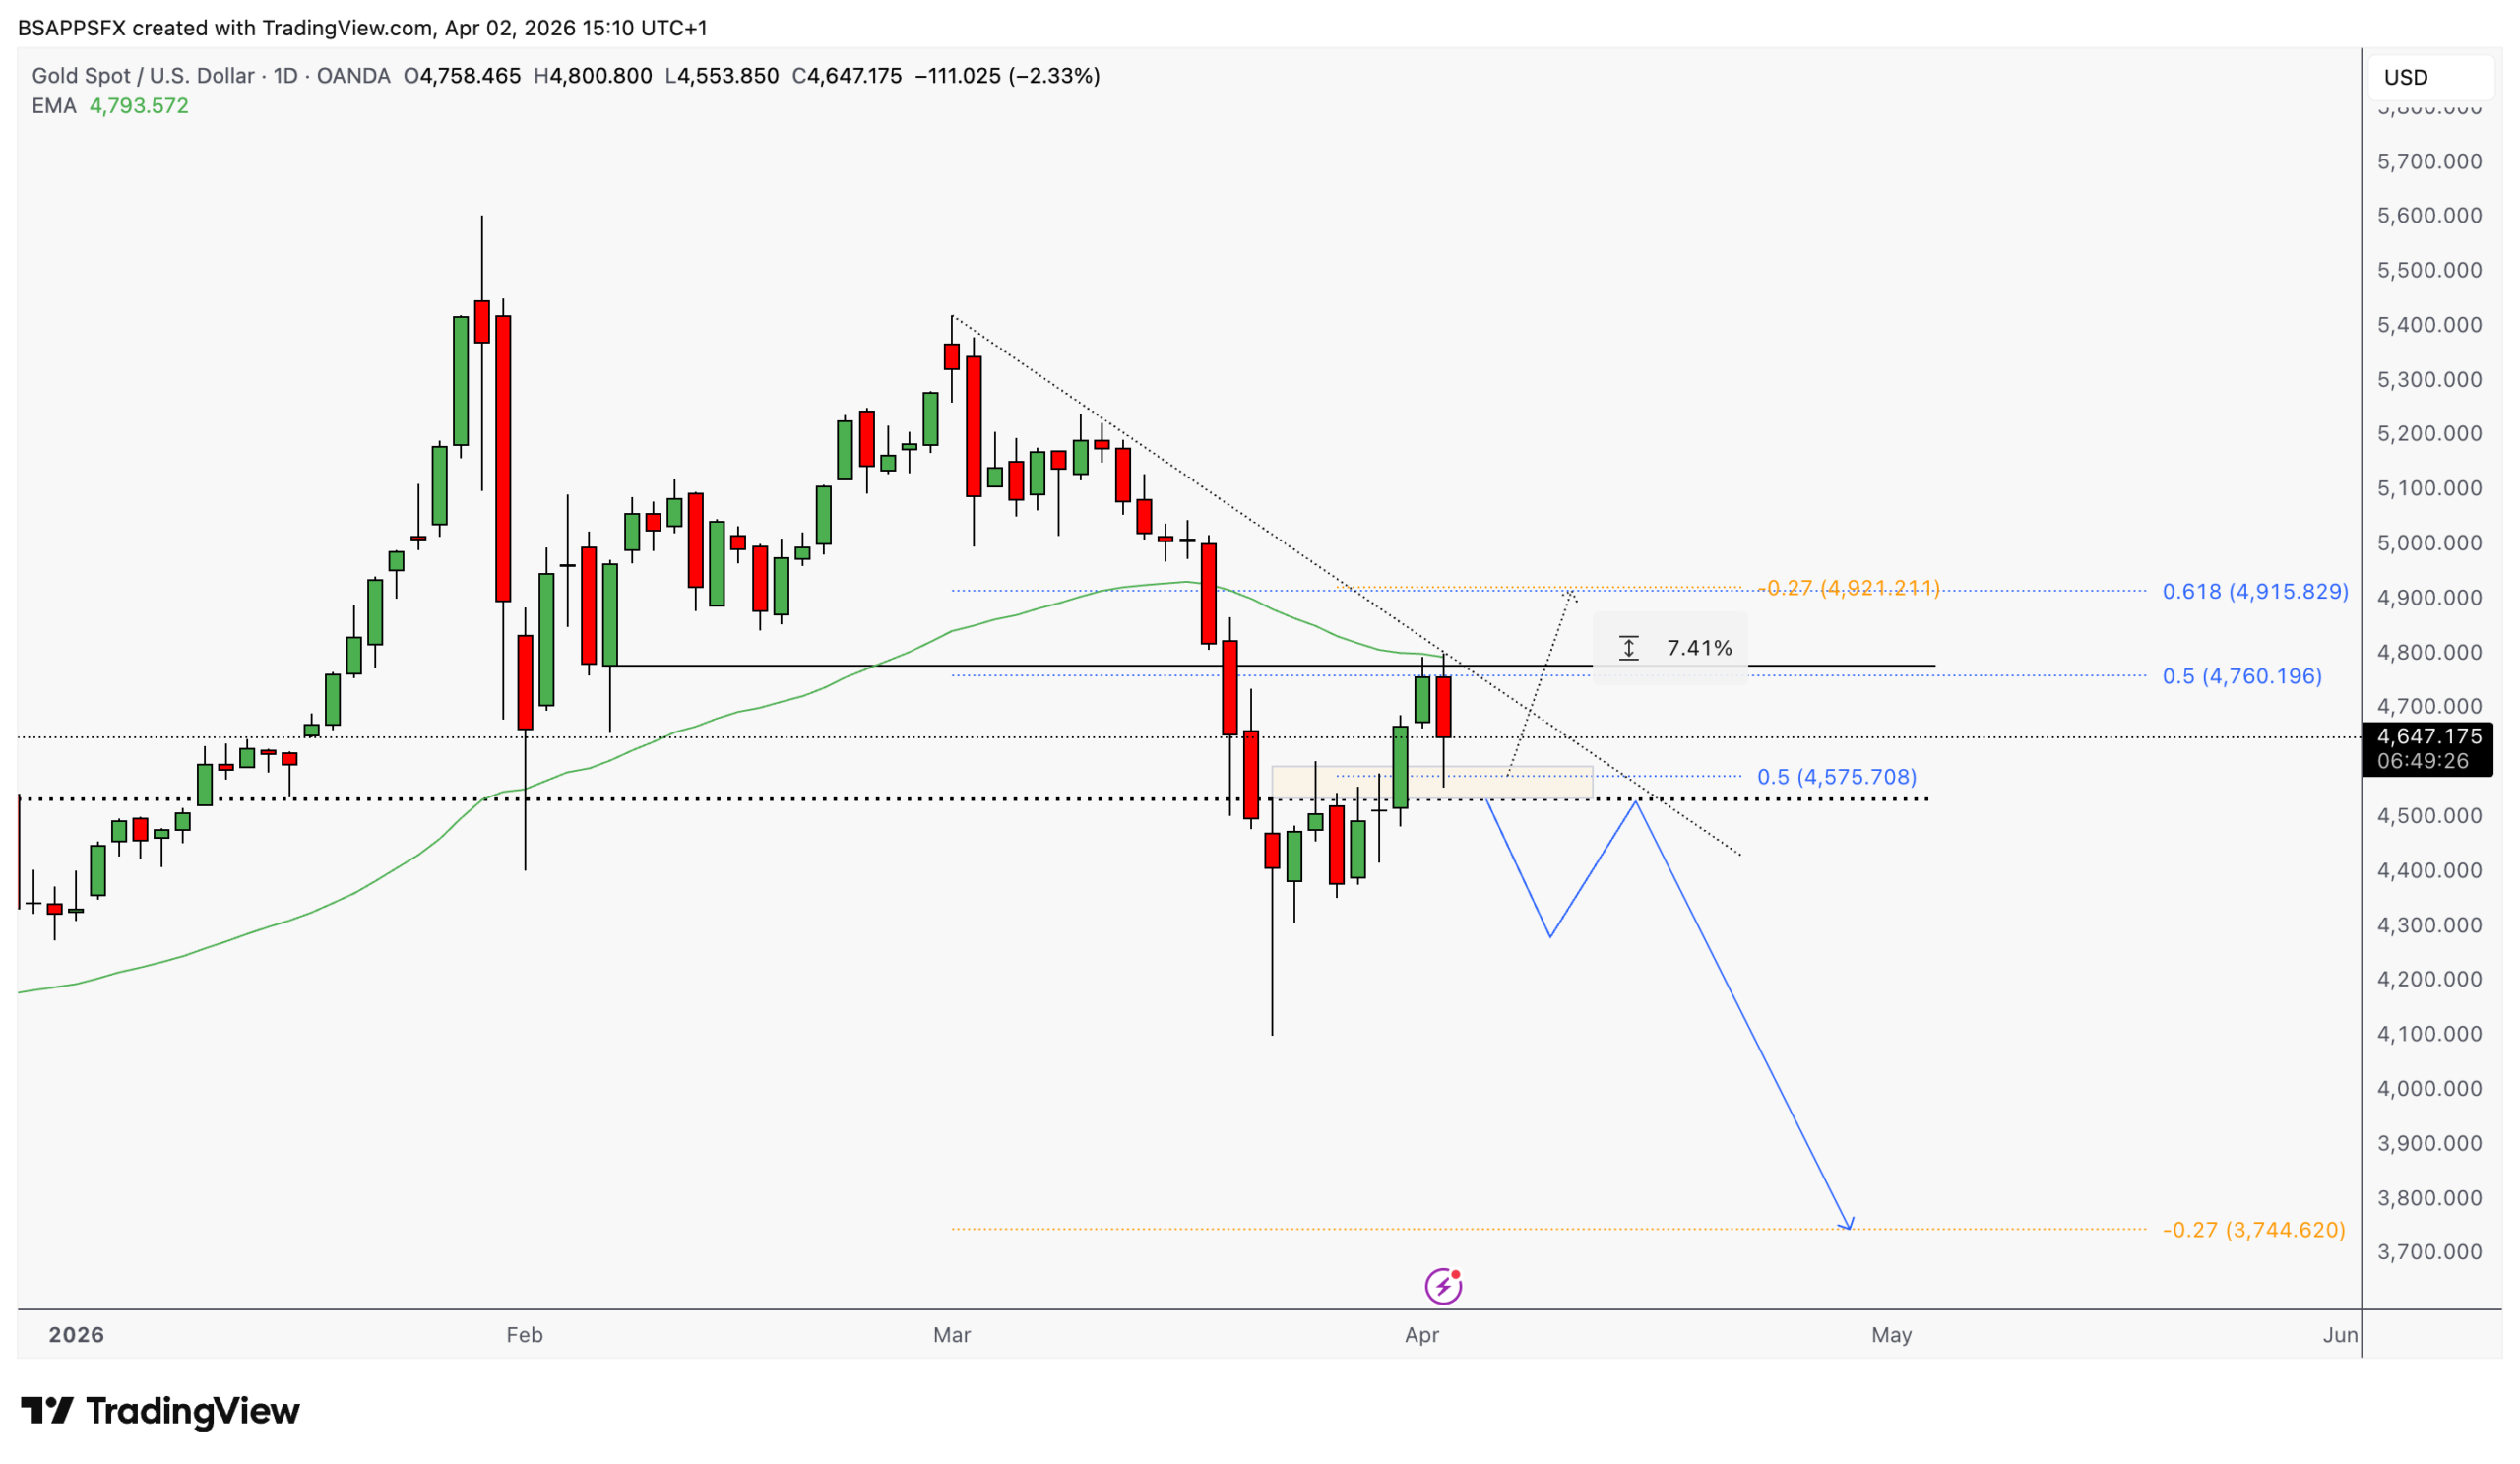
This morning, price rallied into the 50% Fibonacci retracement of the entire drop — sitting at $4,800 — and was simultaneously rejected by the descending trendline from the March highs and the daily 50 EMA at $4,793. Three technical barriers converging within a few points of each other. The rejection has been sharp.
Price is currently being supported by the daily 100 EMA at $4,626. The daily 200 EMA sits at $4,246 — still rising, still pointing to a structurally intact long-term uptrend.
The two paths — 2020 or 2008
Everything documented above leads to this. Two historical templates. Two meaningfully different outcomes. The discriminating variables between them are specific and watchable in real time.
61.8% Fibonacci target. Daily 50 EMA reclaimed. Trend resumes without new lows.
- 100 EMA holds as support on daily close
- Iran situation moves toward resolution
- 10Y yields continue lower toward 4%
- FedWatch June cut probability reaches 25%+
- ETF outflows exhaust, Western flows reverse
- Daily 50 EMA reclaimed with conviction
−0.27 Fibonacci extension. 200 EMA fails to hold. Second leg lower before structural bottom.
- 100 EMA breaks on daily close
- 200 EMA at $4,246 tested — may bounce here first
- Iran conflict persists, oil stays elevated
- 10Y yields sticky above 4.3%
- Second ROC(5) extreme marks the real bottom
- Higher low then higher high — but no new ATH before one final drop
The 2008 template is worth understanding in full detail because it is the more complex and counterintuitive path. In 2008, after hitting an extreme ROC(5) reading of -18, gold retraced approximately 78.6% of the initial drop. Then, as macro conditions failed to improve sufficiently, it sold off again to make a new low. That second low was confirmed by another extreme ROC(5) reading. That double signal marked the definitive structural bottom before the gold bull market of 2009-2011 began in earnest.
Critically: in 2008, the higher high that formed before the final low never took out the all-time high of the time. Price made a higher high, gave traders hope, then made one more lower low. Anyone who bought the first higher high aggressively got caught. The 2008 template rewards patience and precision, not aggression.
Today could follow that same structure. Price drops to the 200 EMA at $4,246, bounces, reaches toward $4,921, fails to reclaim the all-time high, then makes one final low toward $3,744 before the structural bull market fully resumes. We will cover that final phase — if and when it becomes relevant — as a separate analysis.
The levels to watch
The thesis is not a prediction. It is a decision tree. These are the specific levels that determine which branch you are on.
Why today is structurally unlike 2008
The 2008 template may describe the price structure. But the structural backdrop underneath the price is incomparably more supportive today than it was then.
In 2008: central banks were net sellers of 400-500 tonnes per year. ETFs held $10-15 billion. De-dollarisation was not a live narrative. There was no structural Eastern bid. Gold had to find its bottom without an institutional safety net.
Today: central banks have been net buyers every year since 2010 and are buying at record pace. ETFs hold $185 billion with reversal potential in both directions. 16 consecutive months of Chinese central bank purchases. 36 consecutive months for the Czech Republic. New entrants from Africa and Southeast Asia broadening the buyer base. The freezing of Russian reserves in 2022 created a permanent, structural motivation for every non-Western-aligned central bank to hold gold that simply did not exist in 2008.
The floor under gold today is not the same floor as 2008. It is significantly higher, significantly broader, and significantly more resilient to short-term price volatility. If the 2008 price structure repeats, the recovery from the final low will be faster and stronger than 2008 — because the structural demand that took years to build after 2008 already exists today.
“The West is selling. The East never stopped buying. That asymmetry is the most important fact in the gold market right now.”
SappsView · Thinking in Second Order EffectsThe answer is: both
The honest answer to the 2008 or 2020 question is that the current environment contains elements of both — and which template ultimately dominates depends on two things that are not yet resolved: the Iran situation, and the speed of the Fed pivot.
If Iran moves toward resolution and yields continue lower, the 2020 template activates — ETF flows reverse, Western money returns, the structural Eastern bid continues, and gold resumes its uptrend toward and through $4,921 without making new lows.
If Iran persists, yields stay sticky, and the macro deterioration continues, the 2008 price structure plays out — a bounce toward $4,921, a failure to reclaim all-time highs, and one final leg toward $3,744 before the structural bull market resumes from a stronger base. We will cover that scenario as it develops.
What both paths share is the same endpoint: gold substantially higher. The structural case — de-dollarisation, central bank accumulation, dollar system fragility, geopolitical permanent uncertainty — has not changed. It has strengthened. The question is not whether gold resumes its long-term trend. The question is which road it takes to get there, and how long that road is.
Watch the daily 100 EMA close. Watch the 10-year yield trajectory. Watch FedWatch June cut probability after Friday’s NFP. Watch gold’s behaviour at $4,921 if it gets there. Those four data points will tell you everything you need to know about which path is dominant.
The answer is coming.
Data sources: CFTC Commitments of Traders (Code 088691), World Gold Council Central Bank Gold Statistics (February 2026), CBOE Gold ETF Volatility Index (GVZCLS) via FRED, CME FedWatch Tool, TradingView / OANDA Gold Spot USD daily chart.
COT note: February 24 and March 3 figures are estimates derived from sequential weekly changes. March 10–24 figures verified directly from CFTC historical reports.
This article is for informational and educational purposes only. Nothing here constitutes financial advice. Always conduct your own research and consult a qualified financial adviser before making any investment decisions.
Get the next piece delivered direct to your inbox.